Building an MLOps Infrastructure for 24/7 Clinical AI at a Hospital
The Problem
Quinze-Vingts Hospital generates thousands of ophthalmic exams every year across multiple devices — corneal topographers (MS-39), biomechanical analyzers (Corvis-ST), and clinical records entered by physicians. Each device produces data in its own format, its own coordinate system, its own units. None of them talk to each other. The data lives in CSV exports, proprietary databases, and handwritten notes.
Meanwhile, we’ve published research showing that ML models can predict surgical outcomes, classify corneal diseases, and identify high-risk patients with high accuracy. The gap between “this model works on a research dataset” and “clinicians can use this at 3 AM when they need it” is entirely an engineering problem. That’s what this infrastructure solves.
Architecture Overview
The system follows a medallion architecture — bronze, silver, gold, and serving layers — pulling from the hospital’s biomedical data lake where raw machine data is stored.
Bronze Layer: Data Integration
The hospital maintains a biomedical data lake containing raw exports from clinical devices. The bronze layer pulls data from this lake and integrates it with reconstructed data sources:
- MS-39 topography/tomography exports in their native formats
- Corvis-ST biomechanics raw device outputs
- Clinical records from physician databases
At this stage, data retains its original structure — the goal is reliable ingestion and basic validation, not transformation.
Silver Layer: Mathematical Transforms
The silver layer applies mathematical transformations that convert raw device data into computationally useful representations:
- Cartesian reconstruction: Converting polar-coordinate topographic grids into Cartesian spatial maps
- Zernike reconstruction: Decomposing elevation residuals into Zernike polynomial coefficients up to order 6, producing compact features that map to specific optical aberrations (I wrote about this in detail in my post on Zernike polynomials)
- Vector spaces: Transforming measurements into normalized feature vectors suitable for ML models
- Mathematical transformations: Other mathematical transformations specific to the domain (e.g., bidimensional astigmatism…) This is where the bulk of the domain-specific engineering happens — the transforms that turn device-specific outputs into ML-ready representations.
Gold Layer: Aggregated Datasets
The gold layer produces aggregate data tables and datasets ready for model training and analysis:
- 4,000+ features per patient computed across all data sources
- Validated, normalized, and joined on patient/exam identifiers
- Structured for both retrospective research (batch queries) and prospective inference (individual lookups)
- Quality-controlled with outlier detection and physiological bound validation
Serving Layer: Inference Applications
The serving layer hosts inference applications where ML models provide predictions to help clinicians in their diagnosis:
- TabPFN for multi-class diagnostic classification (88.7% accuracy across 7 corneal conditions in our recent BJO paper)
- CatBoost / XGBoost for surgical outcome forecasting and risk stratification
- ResNet / ViT for image-based topographic map analysis
We are currently testing these applications in Phase I of the validation phase, with clinicians evaluating model predictions against their diagnostic workflows.
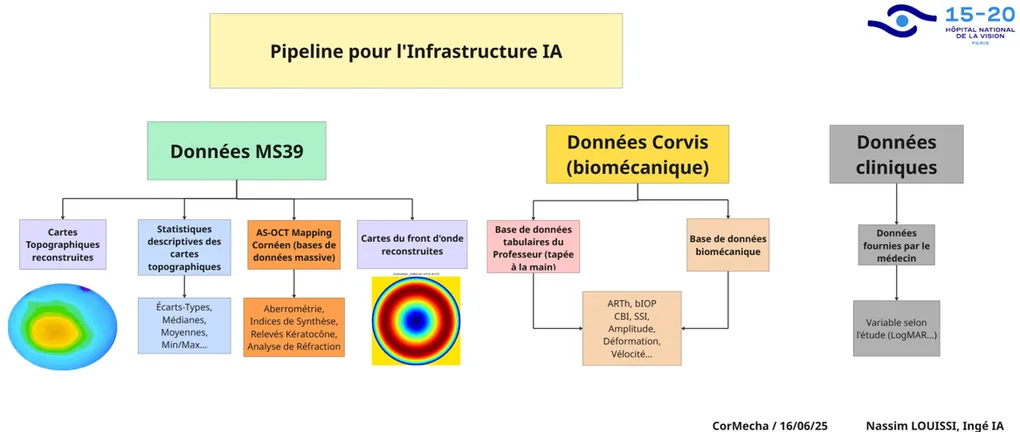
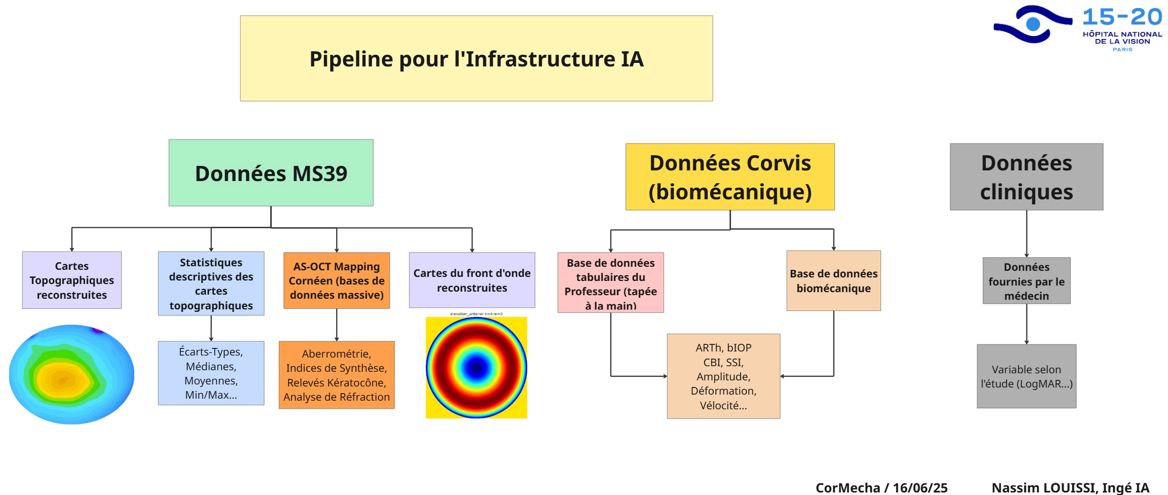
Data Sources
The pipeline integrates three heterogeneous data streams: corneal topography (MS-39), biomechanical analysis (Corvis-ST), and clinical records. Each comes with its own format, coordinate system, and validation challenges — polar-coordinate exports, proprietary device indices, and partially hand-entered physician records.
The engineering work involves coordinate conversions (polar to Cartesian), map reconstruction and validation against device outputs, statistical feature extraction (196 features per eye), symmetry computations between fellow eyes, unit standardization (Snellen to LogMAR), and outlier detection at multiple pipeline stages. Samples that fail validation are flagged for manual review rather than silently dropped.
Where Everything Breaks
The architecture diagram above looks clean. Reality isn’t.
I built this entire infrastructure from scratch, alone, at a hospital where no system talked to any other system. And the hardest problems weren’t the ML models or the Zernike math or the Kubernetes deployment. The hardest problems were the stupid ones.
The MS-39 exports CSV files. Except sometimes it doesn’t — a firmware update silently changes the column order, or a corrupted acquisition produces a file that parses fine but contains garbage values in rows that should be elevation data. Your pipeline ingests it without complaint, computes 196 features from noise, feeds them into a model, and produces a confident prediction that’s completely wrong. Nothing in the monitoring flags it because the values are within physiological bounds. You only find out when a clinician says “this doesn’t look right” three weeks later, and you trace the problem back through four layers of processing to a single corrupted export that poisoned a batch.
The Corvis-ST has its own version of this. Device software updates change export formats without documentation. A field that used to be tab-separated becomes semicolon-separated. A column header gets renamed. Your parser breaks, but it breaks silently — it reads the wrong column and produces numbers that are plausible but wrong.
And then there’s patient matching.
Three different data sources need to be joined on patient identity. The hospital’s clinical database stores names one way. The MS-39 stores them another way. The Corvis-ST stores them a third way. One system has “AKA LOUIS.” Another has “AKA BAMBALA LOUIS.” A third has “LOUIS, AKA B.” These are the same person. Your join logic doesn’t know that.
This isn’t a theoretical problem. This is your training data silently splitting one patient into three, or merging two different patients into one, and your model training on corrupted labels without any signal that something is wrong. The accuracy drops by 2%, which is within your noise floor. You don’t notice for weeks.
I spent more time on patient name matching than on any model architecture decision in this entire project.
The solution isn’t glamorous. Normalize everything — strip accents, uppercase, remove punctuation, standardize spacing. Then compute Levenshtein distance between candidate matches with a threshold of 3 or fewer edits. That handles the vast majority of cases — typos, abbreviations, minor variations between systems.
For the pathological cases — where one system stores a full name with multiple components and another stores a partial name in a different order — Levenshtein alone fails. For those, I implemented token matching: split both names into tokens, compute pairwise token similarity, and accept a match if enough tokens align regardless of order. “AKA BAMBALA LOUIS” and “LOUIS AKA B” share enough tokens to resolve correctly.
It’s not a neural network. It’s not even particularly clever. It’s string processing that took weeks to get right because every edge case you fix reveals two more you hadn’t considered. But once it worked, the entire pipeline’s data quality improved overnight. Predictions became more consistent. Clinicians stopped flagging mismatches. The system became trustworthy.
That’s what production ML actually looks like. Not the architecture diagram. Not the model accuracy. The patient name matching.
Deployment
The serving layer runs on Docker containers, orchestrated with Kubernetes. Each model is packaged with its preprocessing pipeline — the same code that processes research data processes production data, so there’s no train/serve skew. The system is designed for 24/7 availability: a clinician can submit an exam and get a prediction at any hour, without an ML engineer in the loop.
Monitoring covers both infrastructure health (container status, latency, throughput) and model health (prediction distribution drift, feature value ranges, error rates). When the data distribution shifts — a new device firmware update, a change in acquisition protocol — the monitoring catches it before the predictions degrade.
The tricky part is that I had to build everything from scratch, which certainly creates technical debt for other engineers that are using the infrastructure. I’m currently working on the documentation of my work.
Challenges
Most ML in clinical research stops at the paper. A model gets trained on a curated dataset, performance metrics are reported, and the code goes into a repository that nobody touches again. The gap between that and a system a doctor can actually use is enormous:
- Data doesn’t arrive clean and can drift over time (Flynn effect)
- Devices get updated and export formats change
- Clinicians need trust and an understanding of the why
- It has to work at 3 AM
The infrastructure I’m building at Quinze-Vingts handles all of this.
What’s Next
The current system handles MS-39 and Corvis-ST data. The next phase is to include several other machines in order to increase the scope of the system.
Overall, this is my first End to End Machine Learning Production Infrastructure ever. It’s safe to say that it’s not easy. I’m glad I grinded through it. I’m thankful for the opportunity and I still have a lot to learn.
If you’re building similar systems — ML infrastructure or Production Pipelines — I’d like to hear about it. Connect on LinkedIn.